In short
The HMIS Dashboard module of the Punjab Healthcare Commission (PHC) HMIS standard lists the indicators a hospital information system must put in front of management: bed occupancy and length of stay, admissions and discharges, department-wise mortality and readmission, hospital-acquired infections, emergency wait times, staffing ratios, equipment utilisation, revenue and cost, patient complaints and a compliance view for PHC standards. It defines an administrator dashboard plus departmental boards for OPD, ER, IPD, OT, lab and imaging, pharmacy, ICU, infection control and waste, HRM, equipment, inventory and CSSD, and closes with a KPIs dashboard of clinical, surgical, operational, staff, financial and patient-experience indicators.
Key takeaways
- The PHC committee was asked to propose the essential components of a hospital-level HMIS dashboard and the critical patient-safety indicators to be integrated with PHC.
- Priority-one (P1) administrator indicators include bed occupancy, inpatient numbers and ALOS, admission and discharge summaries, department metrics, staffing levels, consumable stock, ER status and PHC compliance reports.
- The KPIs dashboard names specific measures: overall mortality per 1,000 admissions, surgical and ICU mortality, 30-day readmission, SSI and other HAI rates, bed occupancy, LOS, discharge delays and staff-to-patient ratios.
- Every departmental board follows the same pattern: real-time status, resource use, quality indicators, alerts and periodic reports.
- Dashboards must be fed by the operational modules, not retyped, so the data behind each indicator should drill down to the source record.
Why the dashboard chapter matters more than it looks
The PHC HMIS report is the output of a committee of private hospitals from Lahore, Multan and Rawalpindi, formally notified by the Punjab Healthcare Commission on 7 March 2025 after a March 2024 meeting agreed that PHC should issue official minimum HMIS requirements for mandatory implementation. Two of the committee’s four terms of reference concern this chapter directly: proposing the essential components of an HMIS dashboard at hospital level, and proposing the essential patient data and critical patient-safety indicators to be integrated with PHC.
That is why the dashboard module is the longest in the report. It is the part of the standard a PHC assessor is most likely to ask to see on a screen, and it is the part that eventually connects a hospital’s data to the regulator. If the operational modules (OPD, IPD, lab, pharmacy and so on) describe how data gets captured, the dashboard chapter describes what the hospital must be able to show with it.
Propose the essential patient data and critical patient safety indicators to be integrated with PHC.
The administrator dashboard: what P1 means for a medical superintendent
The report tags each requirement with a priority (P1, P2 or P3), with P1 the items a hospital should treat as essential. The administrator dashboard’s P1 items form a useful checklist for any hospital director in Punjab.
- Real-time bed occupancy: total capacity, occupied versus vacant beds, ward-wise occupancy and the availability of ICU, emergency and isolation beds.
- Patient data: current inpatients, admissions and discharges, and average length of stay (ALOS) by department or ward.
- Admission and discharge summary: totals plus transfers with reasons, and pending or in-progress discharges.
- Clinical department metrics: admissions and discharges by specialty, with department-specific KPIs such as mortality and readmission rates.
- Staffing levels and productivity: nurse-to-patient ratio, physician availability, technician load and output such as surgeries performed or tests completed.
- Consumable and supply management: usage and stock levels of critical supplies.
- Regulatory compliance reports: compliance with PHC standards, documentation of staff certifications and training, and audit status for departments such as infection control, laboratory and radiology.
- Emergency room status: triage and waiting times, patient flow and the availability of critical resources such as ventilators and ICU beds.
- Executive summary reports: hospital performance, financials, patient-care outcomes and key operational indicators, with daily, weekly, monthly and quarterly periods.
Departmental boards: one pattern, thirteen departments
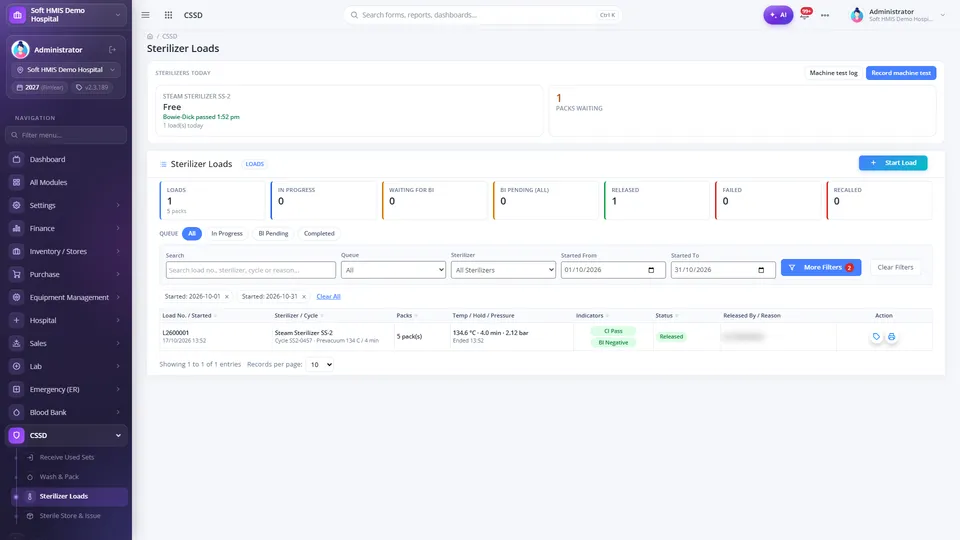
After the administrator view, the report specifies boards for OPD, the emergency department, IPD, OT, lab and imaging, pharmacy, ICU, infection prevention and healthcare waste, HRM, equipment management, inventory and CSSD. Each one repeats a pattern: a real-time operational view, resource utilisation, quality indicators, alerts, and periodic or customisable reports.
A few examples show the level of detail. The OPD board asks for registered, visited, cancelled and no-show counts, department-wise load, doctor utilisation (consultations per hour and idle time) and queue-display integration. The IPD board asks for real-time patient data and bed overview at P1, with drill-down features also at P1. The ICU board asks for bed occupancy and admission or discharge status, staffing against patient load, and KPIs such as ALOS, mortality and the rate of hospital-acquired infections in the ICU. The pharmacy board puts current stock, expiry alerts and adverse drug reaction monitoring at P1.
The practical lesson is that departmental dashboards cannot be bolted on afterwards. Each indicator presumes that the underlying module captures the event, with a timestamp and a responsible user, at the moment it happens.
The KPIs dashboard: the indicators PHC names explicitly
The final section of the module, the KPIs dashboard, is the closest thing in the report to a definitive indicator list. It groups measures into clinical, surgical, operational, staff, financial and patient-experience KPIs, and most of the clinical and operational items are tagged P1 or P2.
- Clinical: patient satisfaction scores; clinical outcomes (mortality, readmission, complications such as SSI and sepsis); mortality indicators including overall in-hospital deaths per 1,000 admissions, case-specific rates (stroke, MI, sepsis, trauma), surgical mortality within 30 days, ICU mortality and early post-discharge mortality at 7 or 30 days; hospital-acquired infections (VAP, CLABSI, CAUTI, SSI) with trends; adverse events and near-misses.
- Surgical: SSI rates per procedure against infection-prevention protocols and benchmarks; surgical complications such as bleeding, anastomotic leaks and anaesthesia-related issues.
- Operational: ED wait times; length of stay by department against benchmarks; bed occupancy rate (P1) across ICU and general wards; readmission rates (P1) including 30-day readmission for CHF, COPD and diabetes and a preventable readmission rate; discharge delays and their causes.
- Staff: staff-to-patient ratios for nurses, doctors and support staff in high-acuity areas; employee turnover and retention.
- Financial: revenue by department, billing compliance, cost per patient and operational costs.
- Patient experience: complaints and grievances by category with response and resolution times; post-discharge follow-up rates.
- Real-time monitoring: thresholds and alerts for KPI deviations, for example infection rates or bed occupancy above a limit; customised and benchmarking reports, including scheduled weekly or monthly reports for leadership and regulators.
What this means for hospitals choosing or upgrading an HMIS
Three design consequences follow from the chapter. First, the HMIS must compute indicators from transactions, not from a spreadsheet filled in at month-end: a mortality rate per 1,000 admissions is only credible if admissions and deaths are both recorded in the same system. Second, the boards must filter by department, ward and period, because the report repeatedly asks for department-wise breakdowns and historical trends. Third, the data must be auditable: the compliance section expects a hospital to show audit status and staff certification records, which means drill-down from a number to the records behind it.
Hospitals should also note what the dashboard chapter does not fully settle. It describes what a hospital-level dashboard should contain and says these indicators are to be integrated with PHC, but the mechanism and schedule of that integration are not specified in the pages we reviewed. Plan for the indicators now; the reporting channel can follow.
How SoftHMIS supports this
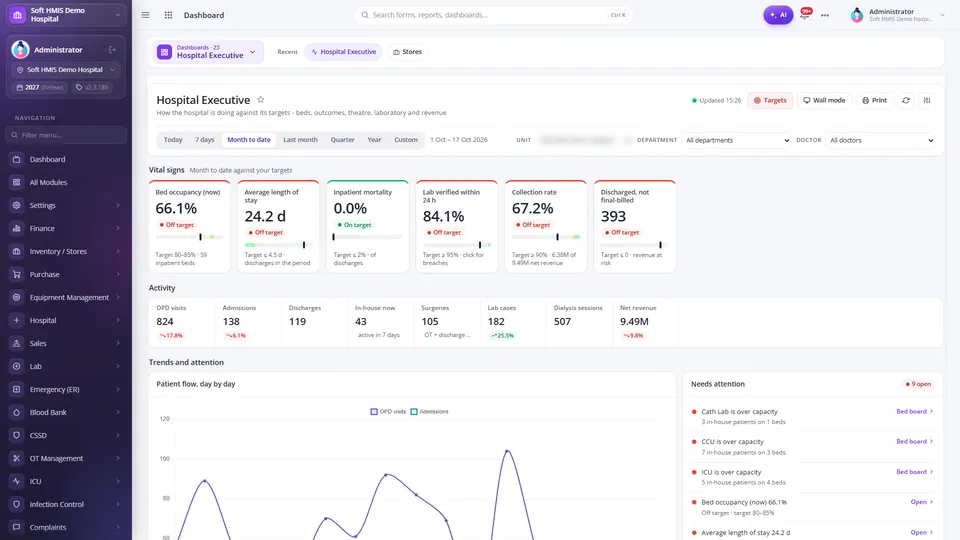
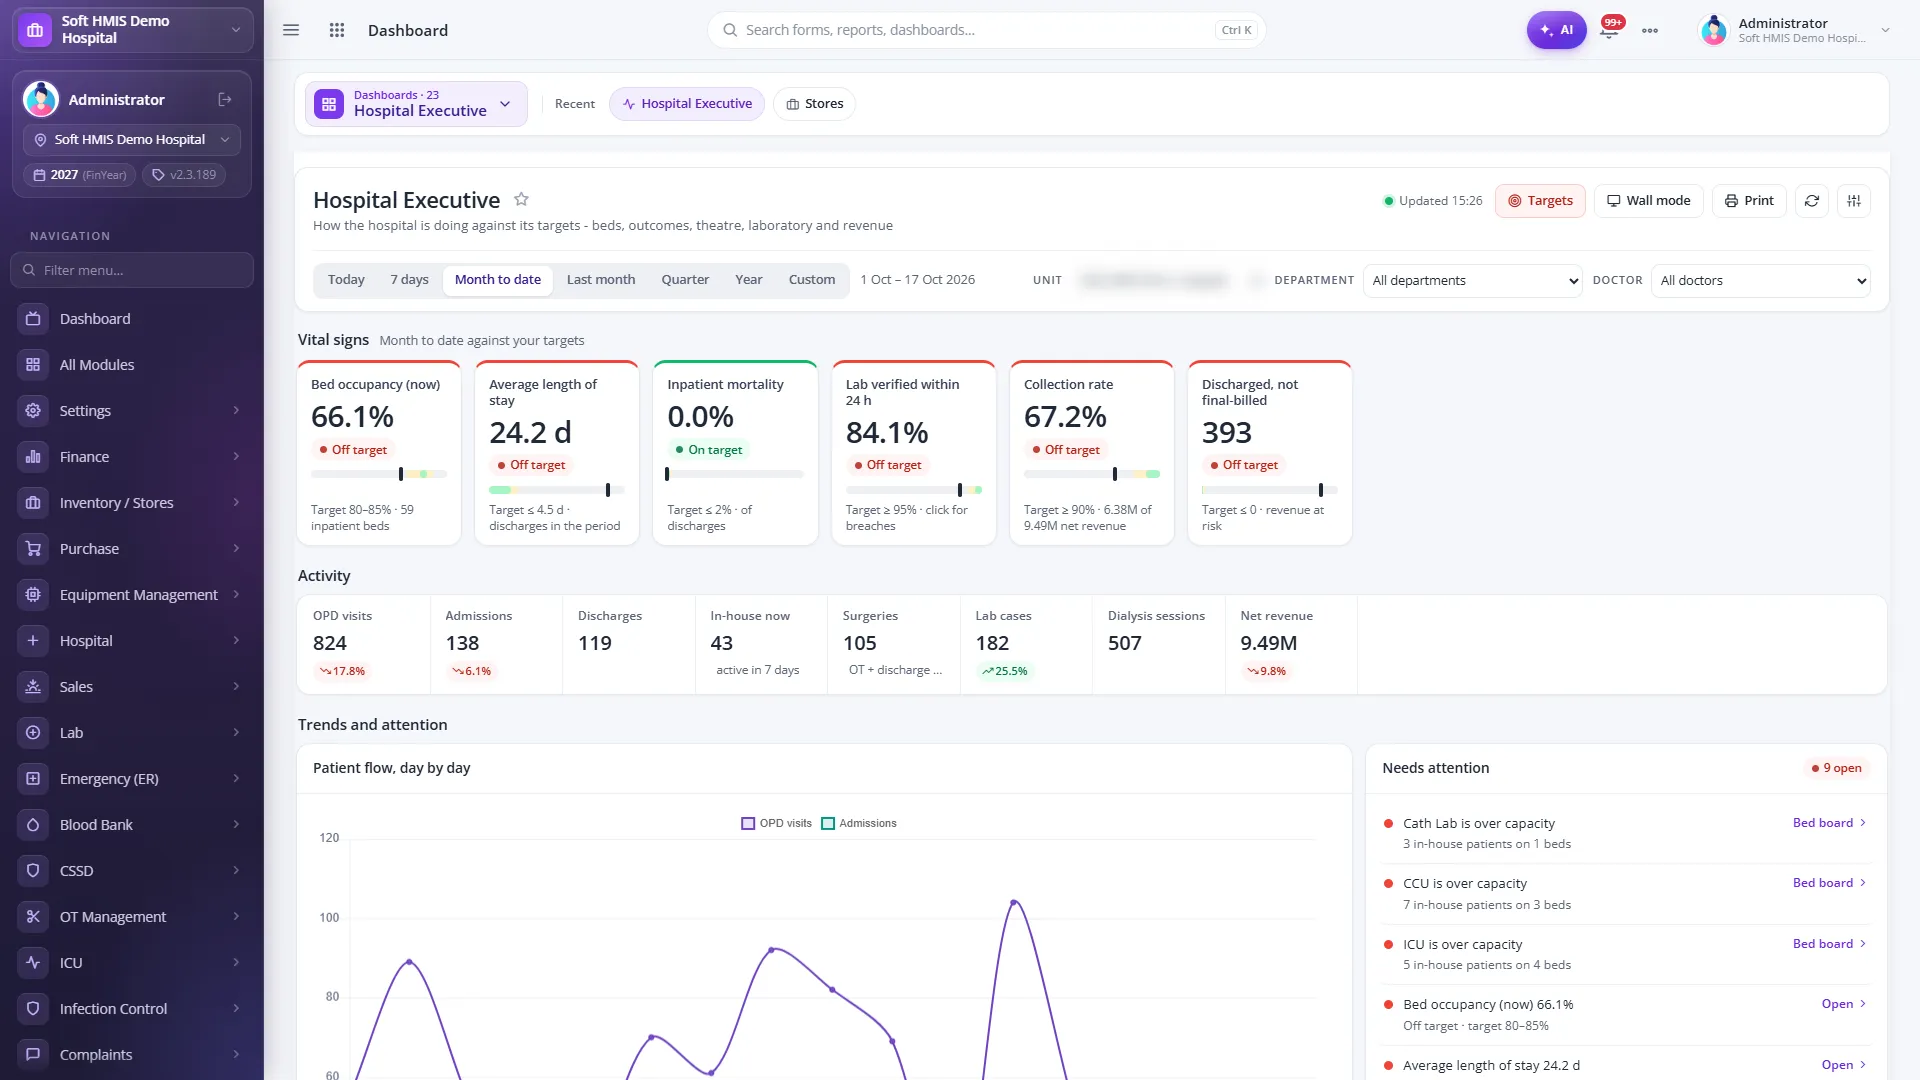
SoftHMIS is designed around the PHC requirements rather than certified by PHC, and its dashboard layer is the part most directly shaped by this chapter. The dashboard hub catalogues 34 boards in six groups (Executive, Clinical, Clinical services, Quality and safety, Finance and revenue, Operations), including hospital boards for OPD, IPD and beds, laboratory, pharmacy, revenue cycle, dialysis, ER and surgery, doctor performance, quality, blood bank, ICU, infection control, complaints, quality improvement and emergency preparedness, with a separate ambulance board.
Every board filters by business unit, date range, department and doctor, and every KPI drills down to the underlying rows, which is what the P1 drill-down and department-wise requirements call for. Boards support targets, a wall (TV) mode and a printable snapshot. The quality module holds a KPI register with a period scorecard against targets; the product deck states that the PHC KPIs are covered and that new KPIs can be added as requirements change. Around 244 analytics reports, including about 40 quality and safety reports, cover the periodic reporting the administrator dashboard describes.
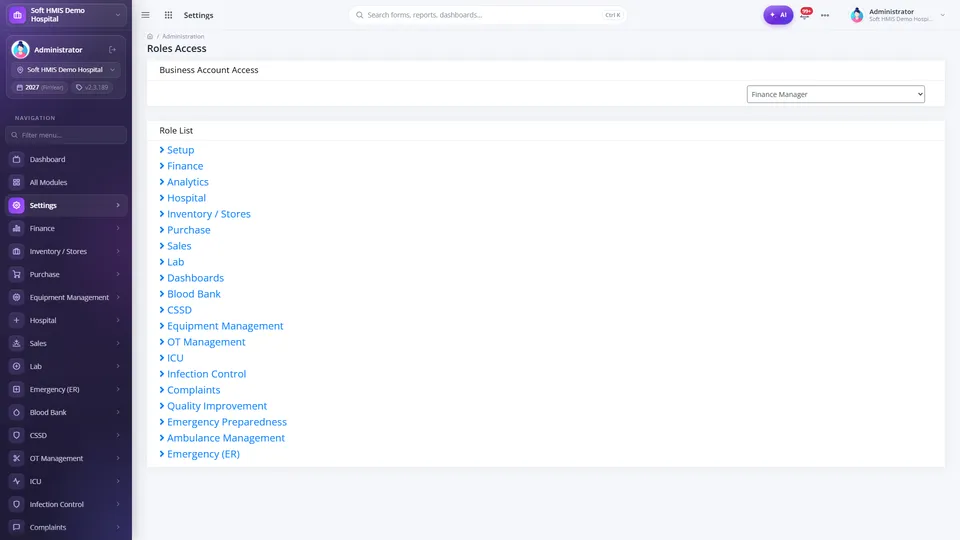
Access to boards is checked on the server by company, module and role, so a board a user may not see is never sent to the browser. That matters for the compliance view, where staff-certification and audit data should be visible to management and the quality team but not to every user.
Frequently asked questions
Which hospital KPIs does the PHC HMIS dashboard require?
The KPIs dashboard section names mortality rates (overall per 1,000 admissions, case-specific, surgical within 30 days, ICU and early post-discharge), hospital-acquired infections (VAP, CLABSI, CAUTI, SSI), readmission rates including 30-day readmission, bed occupancy, length of stay, ED wait times, discharge delays, staff-to-patient ratios, turnover, revenue and cost per patient, complaint response and resolution times, and post-discharge follow-up.
Does PHC require a separate dashboard for each department?
The report specifies an administrator dashboard and departmental boards for OPD, ER, IPD, OT, lab and imaging, pharmacy, ICU, infection prevention and waste, HRM, equipment, inventory and CSSD, followed by a hospital-wide KPIs dashboard. Each has its own priority-tagged indicator list.
What are the P1, P2 and P3 tags in the PHC HMIS report?
The report attaches a priority tag to most requirements. P1 items are the essential core, and P2 and P3 items extend it. Hospitals planning a phased implementation generally start with the P1 indicators and modules.
Will hospital dashboards be connected to PHC directly?
The committee’s terms of reference include proposing the patient data and critical patient-safety indicators to be integrated with PHC. The report defines the indicators; the technical reporting channel and schedule were not specified in the pages we reviewed.
Sources
- Hospital Management Information System (HMIS): minimum requirements for hospitals in Punjab (final report) — Punjab Healthcare Commission, 13 June 2026
- PHC
- HMIS dashboard
- KPIs
- patient safety
- Punjab